Delta2D Workflow
The Workflow window guides you through the analysis process. It gives you quick access to Delta2D's most important functions. You will enjoy the Workflow at the beginning, since it makes it particularly easy to follow Delta2D's 100% spot matching approach. Customers report that new users get productive after playing with the Workflow half a day - just give it a try!
However, you are not forced using it - as an experienced user you will also enjoy having access to each single functionality independently from the Workflow.
For a quick overview please have a look into this presentation:
Analyzing 2DE-Gels in 5 Steps.
 Setup Project

The first step in Delta2D's workflow is to define a project in accordance with the real experimental setup.
Create replicate groups for your experimental conditions and import the respective images.
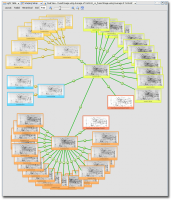
In this step you will make use of a virtual light table to arrange your gel images as you like - simply per drag and drop.
 Warp Images

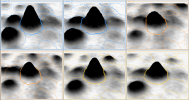
The second step will assist to use Delta2D's core technology, our image warping (introduced in 2000). With warping your gel images spots of the same protein will have the same position across the gels.
Supported by SmartVectors™, image warping is done automatically. However, you keep control: define your own match vectors to align images with automatically created SmartVectors™ to combine the strengths of powerful algorithms with your knowledge about your gel images.
 Detect and Quantify Spots

The aim of this step is to creat an optimal input for quantitative analysis - expression profiles that include reliably matched spots but no missing values. This is done by applying a consensus spot pattern - created on a fused image - to all images of the project.
 Analyze Expression Profiles

Typically, only a fraction of the proteins in your experiment are of interest. Of course, the precise definition of "what is of interest" is the first challenge - make up your mind properly before running your experiment, discuss your experiment with us if you are in doubt.
Finding spots of interest is supported by comfortable sorting and filtering options, plus advanced statistical methods incuding
- Heat map display of expression profiles
- Various methods of clustering including Hierarchical Clustering, k-means / medians Clustering
- Numerous variations of t-Test
- Analysis of Variance (ANOVA)
- Non-Parametric tests, incl. Wilcoxon / Mann-Whitney, Kruskal-Wallis, Mack-Skillings, and Fisher-Exact test
- Pavlidis Template Matching for expression profiles and gel images (PTM)
- Principal Component Analysis (PCA)
 Present Results

Let everyone know about your findings!
Delta2D's html-report interface provides a number of prepared interactive reports. You can save them to publish them on your website or send them to colleagues. Since they are based on custom stylesheets (CSS), you can also change their layout and adapt it to your organization.
Images can be exported as MS PowerPoint slides, quantitative data as MS Excel tables.
As a matter of course, you can export picklists to load them into your picking device.
